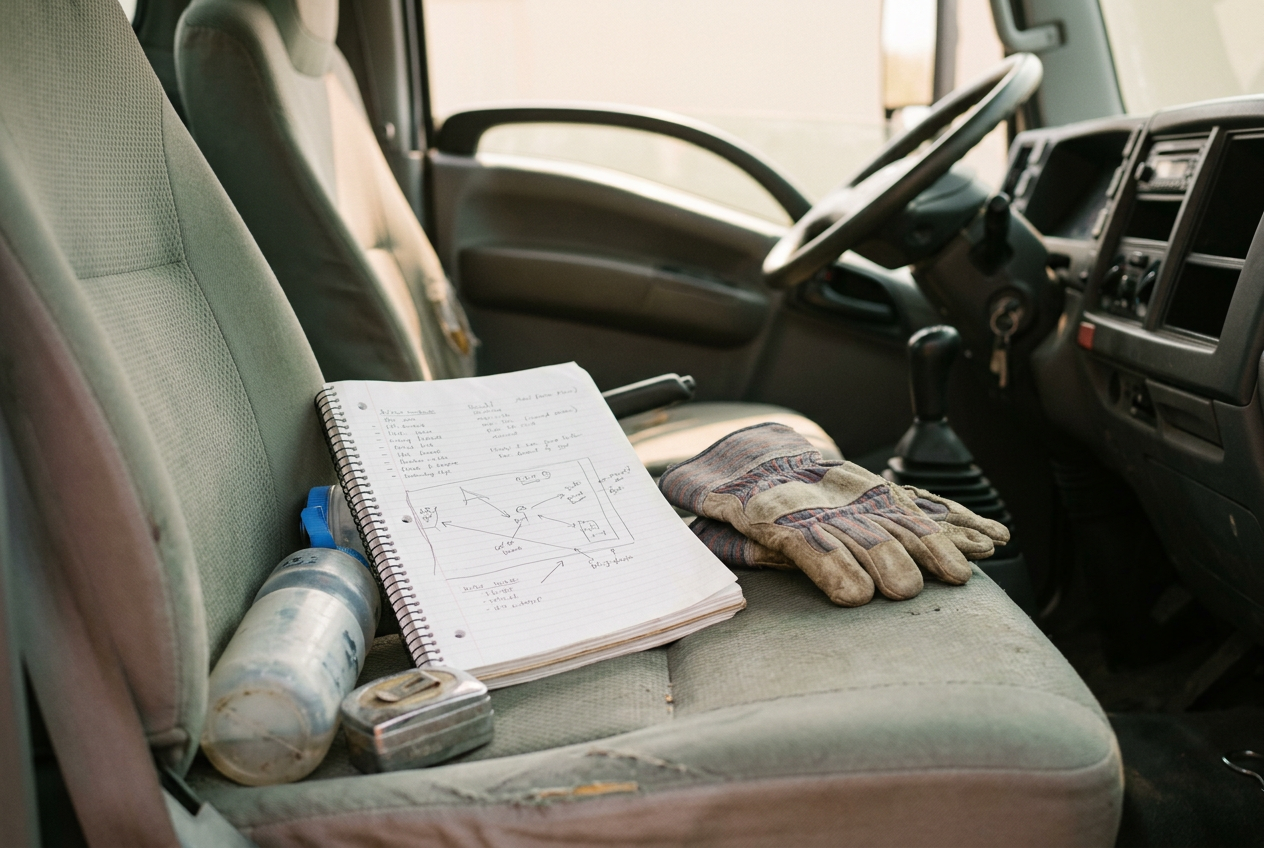
The Route Optimizer Sent His Crew to Bare Yards in Peak Heat
A landscaping crew’s routing app cut miles by placing exposed properties together during the hottest part of the day. Their leader kept a notebook and built a safer route that scored worse.
October 14, 2026 · 8 min read
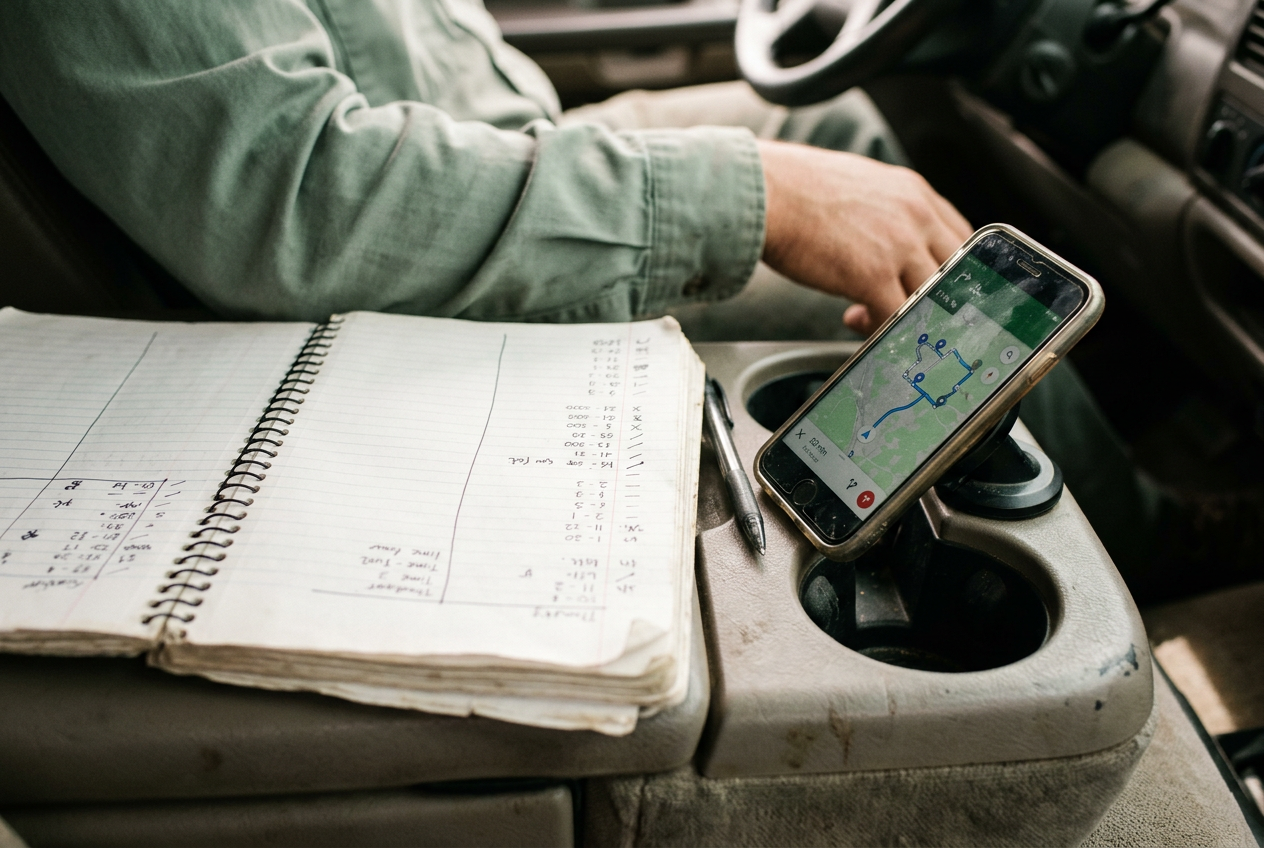
Eli kept a notebook in the cup holder of the crew truck. Each page had two columns. On the left, he wrote the order of properties shown in the scheduling app. On the right, he wrote the order his crew followed.
By July, the columns rarely matched.
Eli led a four-person landscaping crew that maintained residential properties in a growing part of a Southern city. Some yards had mature trees and porches. Others were new lots with low shrubs, young trees and no place to work out of direct sun. The crew mowed, edged, cleared beds and hauled bags back to the truck.
The company had introduced the route optimizer that spring. Before then, a supervisor arranged each crew’s day from a customer list and a map, usually keeping neighborhoods together while accounting for large jobs and requests about access. The new app produced the order automatically and updated it when a job ran long or a customer canceled.
Managers described the change through one number: miles driven. Less driving meant less fuel and more properties completed with the same trucks.
At first, Eli liked it. Addresses that had once been scattered across town appeared in tight groups. The app reduced left turns across traffic and stopped crews from crossing the same main road several times. On some days, Eli reached the last property with enough room to clean the truck bed before returning.
Then the heat settled in.
The route on the phone
The optimizer did more than sort addresses by distance. It predicted how long the drive between properties would take, using past location records and current traffic data, and estimated service time from earlier visits. It then searched for an order that fit customer access windows while reducing travel and keeping the crew near its expected finish.
Those estimates mattered. A property recorded as a 24-minute job could be placed between two longer stops without pushing the rest of the route beyond its target. If crews had finished a yard quickly on previous visits, the system treated that pace as normal.
The app did not receive the information Eli noticed through the windshield. It did not know which yards had tree cover, which driveways reflected heat toward the crew or which new developments had no shaded place for a water break. Weather appeared in a separate screen used by supervisors, but shade and exposure were not route inputs.
A pattern formed. The optimizer placed gated properties and homes with narrow access windows earlier in the day. The exposed lots in one new subdivision became a short bridge between those morning stops and a dense group of afternoon properties. That order saved several miles, so the same yards kept landing in the period when the heat was hardest on the crew.
The historical service estimates tightened the pattern. Workers had moved quickly through those exposed yards the previous summer, sometimes shortening a break or leaving minor cleanup for the next visit. Their phone locations and completion taps recorded only that the jobs were fast. The optimizer learned the result, not the reason.
Eli began marking the exposed properties in his notebook. Over six weeks, 31 of 42 visits to the subdivision appeared in the hottest part of the route. He also wrote down the temperature shown on the truck display when someone felt sick enough to stop. It read at least 96 degrees on five of those days.
One worker developed a headache and nausea while clearing clippings from a driveway. Another sat in the truck with leg cramps. Neither left work, and the crew completed the route, but Eli moved the final exposed property to the next morning without asking a supervisor.
The dashboard counted that as an incomplete stop.
A second route
After that, Eli started rebuilding the route before the crew left the yard. He moved exposed properties earlier and placed shaded yards later. He tried to preserve the same neighborhood groups, though the new order sometimes added a return trip across a main road.
The notebook became his working copy. He drew an arrow beside each address he moved and wrote the extra mileage at the bottom of the page. Most changes added between four and nine miles. One added 13.
The company app continued to display the original route. It compared the truck’s location with the expected sequence, recording when the crew reached a different property or paused somewhere that was not a scheduled address. Supervisors could see those deviations on a dashboard alongside completed jobs, miles and estimated finish.
That turned Eli’s safety adjustment into a performance problem. His crew still completed nearly every property, but its route-adherence score fell. The added miles also erased part of the fuel savings that managers expected from the optimizer.
A supervisor asked why the truck kept leaving the planned path. Eli described the exposed yards and showed several notebook pages. The supervisor did not tell him to stop changing the route, though the original schedule remained the standard used in weekly reviews.
That left Eli with two definitions of a good day. The app favored fewer miles and arrival times close to its predictions. He watched whether someone had stopped sweating, needed to sit down or was losing pace while pushing a mower. Those observations existed only in the right-hand column of the notebook and in the decisions that followed.
The route optimizer was not detecting heat risk and dismissing it. It had no field for the risk. Its output looked precise because every property had a predicted arrival and service duration, while the missing information had no place on the screen.
What the score could not see
Eli’s changes exposed another feature of the system. The same location data that helped predict travel also let the company evaluate whether workers followed the route. A phone in the truck reported movement between properties, and completion taps supplied timestamps. From those ordinary signals, the dashboard inferred delays, unscheduled stops and route departures.
It could not distinguish a water break from idling, or a heat-driven schedule change from poor navigation. A stop beside a shaded public area appeared as time away from a customer property. Eli knew the company could see the truck, but he had not understood that its path would become a measure of cooperation with the schedule.
By late summer, a manager let Eli test a revised set of property notes. Exposed yards received a simple marker that a dispatcher could see before approving the route. The optimizer still did not calculate heat exposure, and someone had to add each marker by hand, but the notes gave supervisors a reason to accept some deviations without treating them as unexplained.
The result was uneven. On days with flexible customer windows, the crew handled exposed properties earlier and kept most of the mileage savings. On crowded days, the app returned to the old pattern because drive time remained its main objective and the marked properties were still close together.
Eli did not reject the optimizer. He wanted the tighter neighborhood groups and fewer cross-town drives. He also wanted the system’s service estimates to stop treating rushed work as proof that a property was easy.
Near the end of the season, he compared eight weeks of notebook pages. His reordered routes had added an average of seven miles a day. The crew had completed three fewer properties than the original plan across that period, while no one had needed to leave a route after becoming sick in the heat.
The dashboard preserved the first two figures. Eli’s notebook held the third.
Questions people ask
Why did the route optimizer keep scheduling exposed yards during peak heat?
The system minimized predicted drive time while fitting customer access windows and estimated service durations. Exposed properties happened to form a convenient geographic bridge between other groups of jobs. Because the app lacked shade and heat-exposure data, it repeatedly selected an efficient route with the same safety problem.
How did past worker behavior affect the schedule?
The optimizer used earlier completion records to estimate future service time. Crews had rushed through exposed yards and shortened breaks, so those properties looked unusually fast in the data. The system treated the recorded pace as a normal job duration and used it when building later routes.
What worker data did the company collect through the app?
The truck phone supplied location data, while workers’ completion taps marked the progress of each job. The company used those signals to predict travel and judge route adherence. The dashboard could identify a pause or changed sequence, but it could not tell whether heat, traffic or poor navigation caused it.
Did changing the route improve the crew’s performance?
It depended on the measure. Eli’s routes added an average of seven miles a day and produced three fewer completed properties across eight weeks. No crew member had to leave a reordered route after becoming sick in the heat, a result recorded in the notebook rather than the dashboard.
One story a day
The story of the day, in your inbox
One real story about AI each morning — no hype, no alarm, just company for the road.