A Union Steward Rebuilt the AI Score Behind 14 Warnings
Workers were warned for falling below 85 percent efficiency. Their union steward found that the AI benchmark changed while unscanned work counted against them.
September 19, 2026 · 8 min read

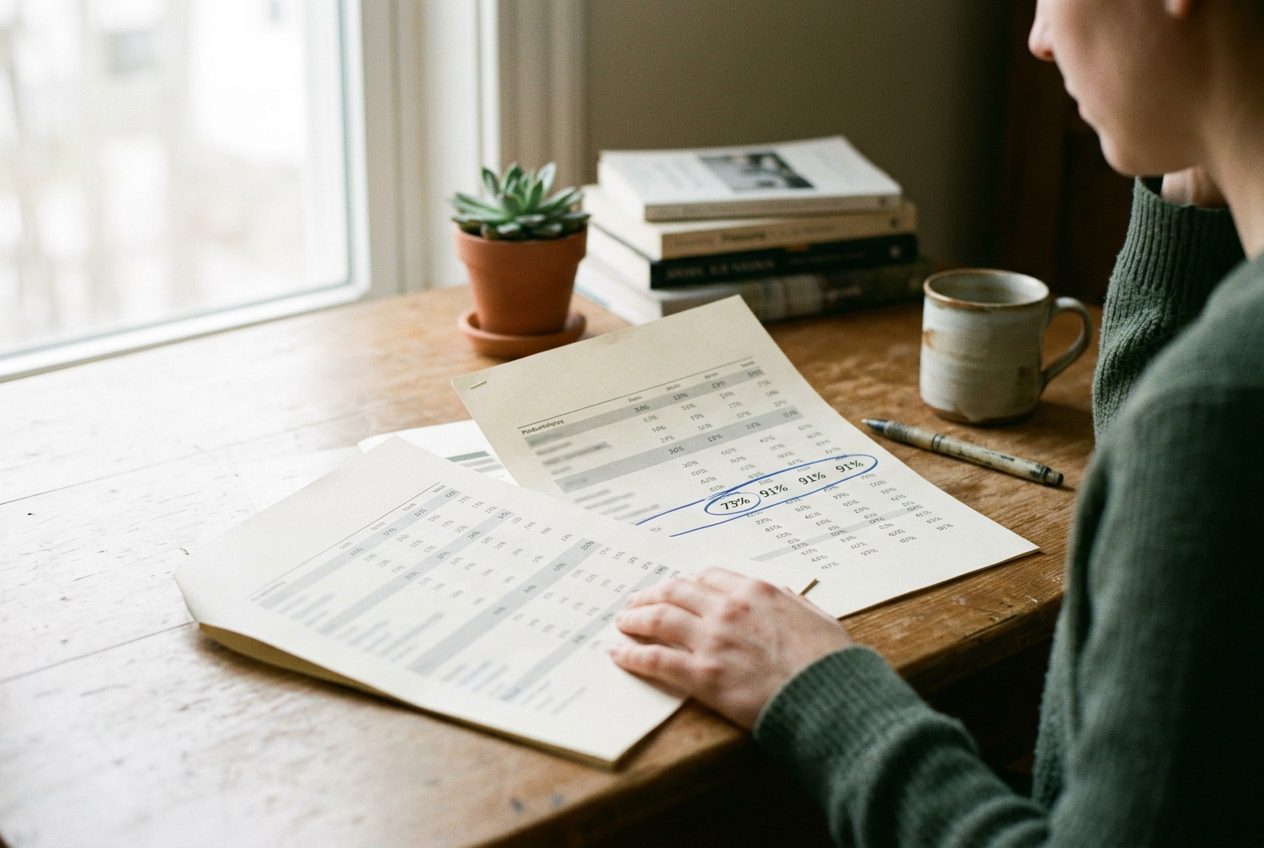
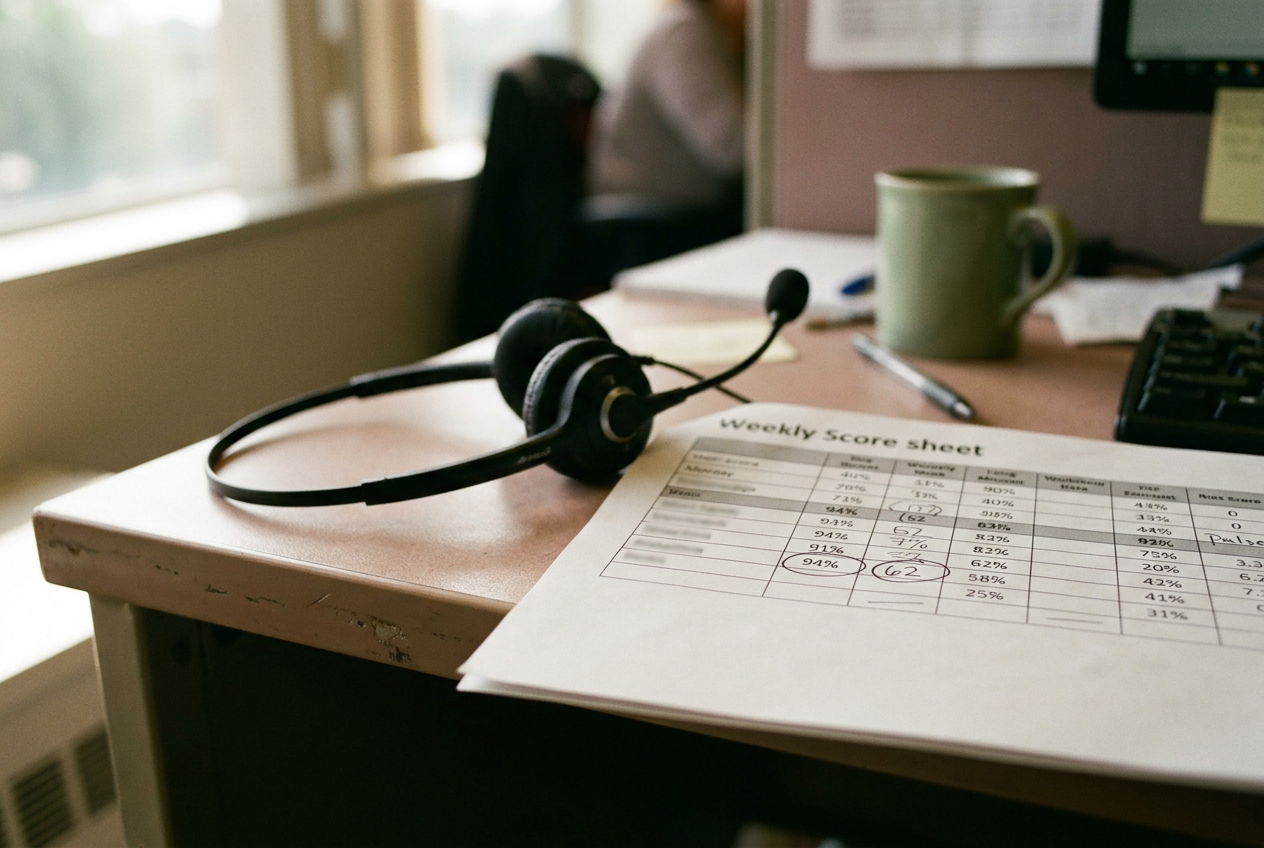
The artifact was a spreadsheet with 27 columns. The steward started it after a warehouse worker brought her a warning and a screenshot from the productivity dashboard. The screenshot showed an efficiency score of 78 percent, a red bar, and a weekly average. It did not show how many minutes the system expected his work to take or which part of his shift had pulled the score down.
His supervisor could see the same red bar. When the steward asked for the calculation, the supervisor opened several dashboard views and found totals for completed tasks, scanned items, and time on shift. None of those numbers produced 78 percent. The supervisor had been trained to discuss the score with workers, not to calculate it.
The warning mattered. A second low week could bring another disciplinary meeting, and repeated warnings could affect preferred shifts or continued employment. The company treated 85 percent as the line between acceptable work and a performance problem.
The number behind the red bar
The warehouse used a predictive model to assign an expected number of minutes to each bundle of tasks. It considered where items were stored, how many units were in an assignment, the route between scan points, and completion records from earlier work that the system treated as comparable. The result was not a fixed rate such as 40 items an hour. Each assignment arrived with its own machine-generated allowance.
The dashboard then compared those credited minutes with the minutes it classified as available for work. A worker who received 340 credited minutes across 400 available minutes landed at 85 percent. Paid breaks and approved equipment failures could be removed from the available total. Other gaps remained unless a separate event in the company’s systems explained them.
This was where the machine did more than deliver a policy. The expected minutes changed as the model absorbed new task records, while another part of the system classified stretches without scans as productive time, approved delay, or idle time. Workers could complete the same route in the same number of minutes and receive different scores after a model update because the predicted allowance had moved.
The dashboard hid both parts. It showed the final percentage but not the prediction attached to each task, the model version that produced it, or the way an unscanned interval had been classified. A conventional quota could at least be multiplied by hours worked. This score had to be inferred backward.
The steward added the first warning to her spreadsheet. Each row represented a shift. The columns held scheduled minutes, recorded break credit, task bundles, scan totals, observed delays, and the final score. She included a column for work that left little trace in the task log, such as helping a new employee or moving goods after a damaged pallet stopped the usual route.
She did not have the model’s expected minutes, so she solved for them. If the dashboard showed 78 percent and the records showed 410 available minutes, the system had credited about 320 minutes of expected work. That figure went into the spreadsheet as an implied allowance.
Reconstructing a moving target
Over six weeks, 13 more workers brought warnings or low-score screenshots. The steward matched them with schedules and task logs, then compared assignments that began and ended at the same scan locations and contained similar item counts. The spreadsheet was rough at first. A missed scan could make one route look longer, and the task log did not record every obstruction.
A pattern emerged after she grouped the records by month. The model had credited one common type of assignment with about 46 minutes in the spring. By late summer, nearly identical assignments received between 38 and 41 implied minutes. Actual completion times had not fallen by the same amount.
The benchmark had tightened by roughly 11 to 17 percent, but the dashboard gave workers no notice that the expected time had changed.
The task history suggested why. The prediction model learned from completed assignments, and recent records included a period when the warehouse had moved more of those goods closer to the main work area. Faster trips entered the comparison pool. After the goods moved back, the model continued assigning shorter allowances for a time because location alone did not capture congestion, blocked access, or the extra handling that some loads required.
The system was confident about ordinary signals it could count. It knew that a scan occurred at one location and another scan followed later. It knew the number of units attached to the assignment. It did not know that a worker had spent 24 minutes showing a new hire how to secure a load, because that work produced no task completion event under the experienced worker’s account.
Eleven of the 14 warnings included at least 40 minutes of work or delay that had no matching code in the logs used for scoring. One worker waited for replacement equipment. Another was reassigned to clear returned goods, which the scheduling record showed but the productivity dashboard did not credit. The model did not decide that those workers were lazy.
It made a narrower error with the same practical result: it treated the missing events as minutes in which assigned work could have been completed.
The 27-column spreadsheet also showed a less convenient fact. Three low scores remained low after the steward accounted for the benchmark shift and the missing work. Those workers had taken longer than the model’s implied allowance across most of their assignments. She kept those rows.
Removing them would have made the audit cleaner and less accurate.
What changed after the audit
At a labor meeting, the steward brought printed sections of the spreadsheet rather than arguing from the dashboard screenshots. She showed pairs of similar assignments with different implied allowances, then laid the schedules beside task logs that documented reassigned work. The company’s operations staff could confirm the inputs. They still could not reproduce every prediction from the model.
Two warnings were withdrawn because the company accepted that the workers had performed duties missing from the productivity record. Four more were held while supervisors reviewed the underlying shifts. The employer also stopped using the score as the sole basis for discipline for 60 days and began giving the union a weekly export with credited minutes by task category.
That export answered one question and opened another. It showed how much time the system awarded, but not why one bundle received 39 minutes while a similar bundle received 44. A model version appeared in the file after the union asked for it. The training data, feature weights, and rules for choosing comparable work remained outside the steward’s view.
Her job changed. Before the dashboard, a performance dispute usually began with a supervisor’s observation or a count that both sides could inspect. Now she spent part of each week checking whether machine-predicted minutes lined up with the work people remembered doing, and whether the ordinary signals captured by scanners left an important part of the shift blank.
The score was useful in one limited way. It exposed recurring equipment waits that supervisors had treated as isolated complaints, because the steward could see the same unexplained gaps across workers and weeks. The company added a simpler way to record some delays. Workers still had to notice that the event was missing before the score became final.
Eight months after the first warning, the threshold remained 85 percent. The dashboard still displayed a red bar. The steward’s spreadsheet had grown past the printed pages she first carried into the meeting, with a column for the model version and another for minutes the warehouse system could not see.
Questions people ask
How was the AI productivity score calculated?
The system divided machine-predicted task minutes by the minutes it classified as available for work. The predictions came from item counts, scan locations, routes, and historical completion records. Because both the expected task time and the treatment of unscanned gaps could change, the same amount of visible work did not always produce the same score.
Why did unscanned work lower a worker’s score?
The system relied on events recorded by scanners and other workplace tools. Training a new employee, handling returned goods, or waiting with no approved delay entry could leave no event that the scoring system recognized. Those minutes stayed in the available-time total while adding little or no credited work to the other side of the calculation.
Could the supervisor explain the warning?
The supervisor could view the final percentage and the underlying task totals, but could not see each prediction or reproduce the score. In this case, the dashboard had turned a model output into a disciplinary fact while withholding the task allowances and gap classifications needed to check it.
What did the union use to challenge the scores?
The steward compared dashboard percentages with schedules, task logs, and workers’ accounts of missing duties. She calculated the implied minutes that the model must have credited, then matched similar assignments across months. The company later supplied a weekly export, which she continued entering into the 27-column spreadsheet.
One story a day
The story of the day, in your inbox
One real story about AI each morning — no hype, no alarm, just company for the road.