An AI Lender Mistook a Vendor’s Festival Rush for Growth
One strong month lifted a street vendor’s automated score. The $7,800 advance looked manageable until $624 weekly withdrawals met the quiet season.
November 3, 2026 · 7 min read

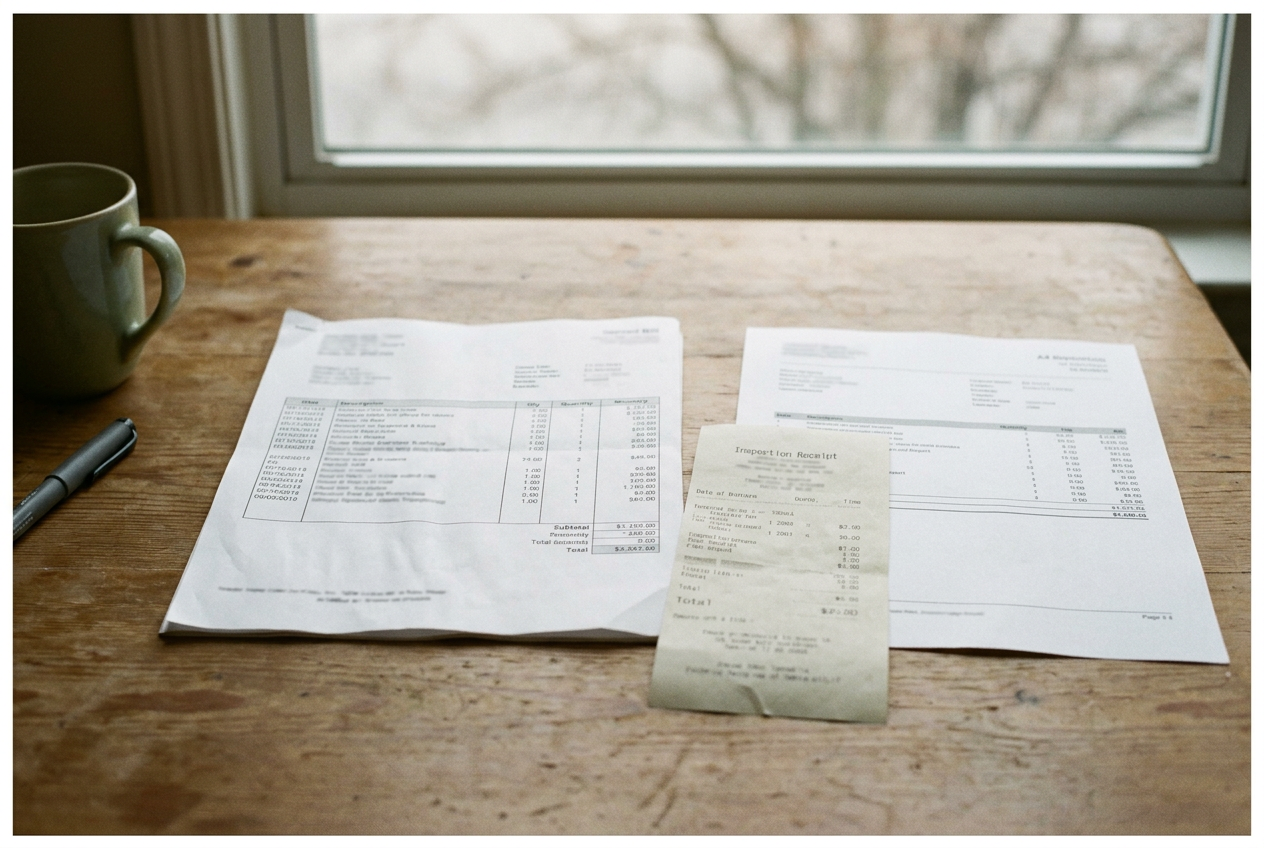
The paper Rosa kept was a printout from her lender’s account dashboard. Two lines mattered: “Estimated weekly sales: $2,460” and “Weekly repayment: $624.”
The first number was a projection. The second was an obligation.
Rosa is a composite of street vendors who use digital lenders tied to card-processing accounts. She sold grilled food and bottled drinks from a cart in a midsize American city. For seven months, her card sales had usually landed between $3,800 and $4,600 a month. Cash added more, though the lender could not see all of it.
She had borrowed through the same platform once before. That advance was $2,400. The lender collected a fixed amount each week from her business checking account, and she finished paying it after twelve weeks. She liked that no one asked for a business plan or an appointment.
The offer appeared on her phone, she reviewed the total cost, and the money arrived after approval.
The second offer came after the city’s fall festival.
For one month, the cart stood near the festival entrance. The organizer encouraged cashless payments, so nearly every order went through Rosa’s card reader. Her card sales reached $11,840, more than twice her usual total. Transaction counts rose with them.
Some days showed nearly four times the ordinary number of card purchases.
Rosa knew why. The lender’s model saw a different pattern.
The number on the dashboard
The lender received a stream of ordinary business data through Rosa’s connected card account: the value of each sale, the number of transactions, recent changes in volume and the share of days with revenue. It also had her repayment record from the first advance.
A machine-learning model used those signals to estimate future sales and rank how much the company could offer. Unlike a fixed worksheet that might average seven months of revenue, the model gave strong weight to recent activity and compared Rosa’s pattern with patterns from many other merchants. Her latest month looked less like a temporary event and more like a business entering a higher sales band.
That distinction produced the offer. The system raised her available advance to $7,800 and projected weekly sales of $2,460, close to the pace recorded during the festival. The repayment terms called for $624 a week over fifteen weeks, for a total of $9,360.
The error was not a bad addition problem. The model inferred momentum from recent card activity, and that inference changed both Rosa’s score and the amount placed in front of her. A static cap based on her longer average would have produced a smaller offer. A human looking at a city calendar might have noticed the festival.
The model had transactions, not context.
It also saw a shift toward card payments without knowing the organizer had caused it. During ordinary weeks, some customers paid cash. At the festival, nearly all purchases appeared in the connected account, which made the jump in visible revenue larger than the jump in Rosa’s total business.
Rosa did not see the model’s weights or the merchants used for comparison. She saw the result. On the dashboard printout, $2,460 looked like an estimate the company had reason to trust.
She compared $624 with the festival month and accepted.
The quiet months arrive
Rosa used $3,100 for repairs to the cart and set aside $1,900 for commissary rent through winter. The rest covered food, packaging and the gap between buying supplies and collecting sales. Those were expenses she already had. The larger advance let her handle them together rather than delaying the repair.
November card sales fell to $5,060. The festival was over, but office workers and construction crews still bought lunch outside. Rosa made the weekly withdrawals without moving money between accounts.
December came in at $3,120. January brought $2,740.
The lender continued taking $624 each week. In a four-week stretch, that was $2,496, nearly all of January’s card revenue before food costs, commissary rent or the cart’s fuel. Cash sales helped, but winter reduced those too.
Rosa returned to the dashboard printout. The projected weekly sales of $2,460 had been close to her actual weekly pace during the festival. In January, it was close to her total card sales for the month.
The system had treated the latest month as evidence about the next several months. Seasonal forecasting can account for recurring peaks when a system has enough history to identify them, but Rosa’s connected account held only seven months of sales. It had never seen one of her winters or an earlier fall festival. Recent data was abundant.
Annual pattern data did not exist.
This is one reason a confident forecast can fail for a young or newly connected business. A model can find that rising transaction frequency often predicts continued growth across many merchants, then apply that relationship to a vendor whose spike came from a one-time event. The relationship may work often enough to guide thousands of offers while still being wrong about the person holding one offer.
Rosa first covered a withdrawal from money reserved for commissary rent. The next month, two withdrawals failed, leaving $180 in combined lender and bank charges. She began buying smaller amounts of food more often, which cost more per unit but kept enough money in the account for the next debit.
There was no box on the dashboard for festival sales.
A person looks at the season
Rosa contacted the support inbox and sent photographs of four pages from her sales notebook. Each page showed one month. Beside October’s $11,840 card total, she had written “festival.” Beside January’s $2,740, she had written “cold month.”
She also sent the festival vendor pass and the dashboard printout. Her point was contained in those papers: the strongest month came from a specific event, while the repayment amount had been set as though that month described the business.
The first response explained that offers were generated from connected sales and repayment history. Rosa asked for a person to review the timing. After further messages, the company reduced the weekly withdrawal to $390 and extended the collection period by nine weeks. The original fixed repayment total remained, while the failed-payment charges did not disappear.
That change kept the cart open. It did not restore the commissary money Rosa had moved or the higher prices she paid for smaller supply orders. By spring, sales improved enough for her to finish the balance.
She remained divided about the lender. The first advance had worked. The second paid for a repair she needed, and quick approval mattered because the cart could not earn while part of its cooking surface was unusable. Her objection was narrower: the number rose because the system believed the festival month would continue, while she accepted partly because a larger offer looked like evidence that the lender understood her business.
Eight months later, another offer appeared. The available amount was $9,200. Her recent sales had climbed again with outdoor events, though the dashboard no longer displayed the old projected-sales line.
Rosa did not accept it. She opened her notebook and separated event weeks from ordinary weeks before deciding how much cash the cart could carry. The $7,800 printout remained folded behind the October page.
Questions people ask
How did the
AI mistake festival sales for steady growth?
The model used recent card volume, transaction frequency and repayment history to estimate future revenue. It did not know that a festival and its cashless-payment policy had caused the spike. With only seven months of account history, it also lacked an earlier fall and winter for comparison.
Why did the lender offer more money so quickly?
Machine-learning underwriting can update a merchant’s score whenever new transaction data arrives. Rosa’s sales count rose, more revenue became visible through the card reader, and she had repaid an earlier advance. Together, those signals moved her into a higher projected-sales group without requiring a new human review.
Would a human review have caught the seasonal problem?
A person could connect the sales spike to the festival if given the calendar, vendor pass or Rosa’s notebook. That did not mean every reviewer would reach the same decision. In this case, human review changed the weekly withdrawal after the automated offer and schedule were already in place.
Are automated sales projections guaranteed to match future revenue?
No. They are estimates built from available data and patterns learned across other accounts. They may miss cash sales, one-time events or seasons absent from a short history. On Rosa’s printout, estimated weekly sales remained $2,460 even after January card sales totaled $2,740 for the month.
One story a day
The story of the day, in your inbox
One real story about AI each morning — no hype, no alarm, just company for the road.